
A cornerstone of the Management Suite in the EDB Postgres Platform is EDB Postgres Enterprise Manager (PEM). The suite provides key management, monitoring, and development capabilities. PEM is designed for monitoring and managing both small and large fleets of PostgreSQL and EDB Postgres Advanced Server installations on a 24 x 7 basis. One of the key features is collection of host and database metrics for visualization on dashboards, performance analysis, and alerting purposes.
Alerts are configured based on templates, over 230 of which are included out-of-the-box, which calculate a value of interest based on one or more of the metrics. Each instance of an object for which an alert may be configured (for example, a host, database server, database, or table) may have similar or different settings for the threshold value that determines the alert level (or lack of) and reporting options used to notify the appropriate people.
Alert notifications may be sent in a number of ways, in addition to being viewed on the PEM dashboards:
- SMTP: Email groups may be defined covering different time periods and alert levels. When an alert is detected or its level changes, the users in the appropriate email group will be notified via email. Each instance of an alert may be configured with different email groups.
- SNMP: Each instance of an alert may be configured to send SNMP traps to an upstream monitoring system when an alert is detected or its level changes. PEM includes functionality to generate an MIB file to describe the alerts that might be received by the upstream monitoring system.
- Script execution: Each instance of an alert may be configured to execute a script when the alert status changes. This script may be executed on the affected host (for example, to restart a service), or on the PEM server, where it may be used to notify administrators in any way desired; for example, by calling the RESTful API of an SMS service provider.
- Nagios passive service checks: Each alert may be configured to send passive service check results to a Nagios instance. PEM provides the functionality to generate the Nagios configuration files that describe both the hosts (agents in PEM) and services (alerts in PEM).
In the following paragraphs we’ll look at how PEM may be configured to integrate with Nagios, a leading open source monitoring solution. We assume for the sake of argument in the examples below that both Nagios and the PEM server are running on the same server, running on CentOS 7.2 with Nagios Core version 4.0.8 installed from the EPEL package repository. PEM version 6.0.2 or later should be used.
Core configuration
Before any alerts can be sent to Nagios, PEM must be configured to enable Nagios support and to know where the Nagios command file can be found.
- Open the PEM web or desktop client, and log in to your PEM server.
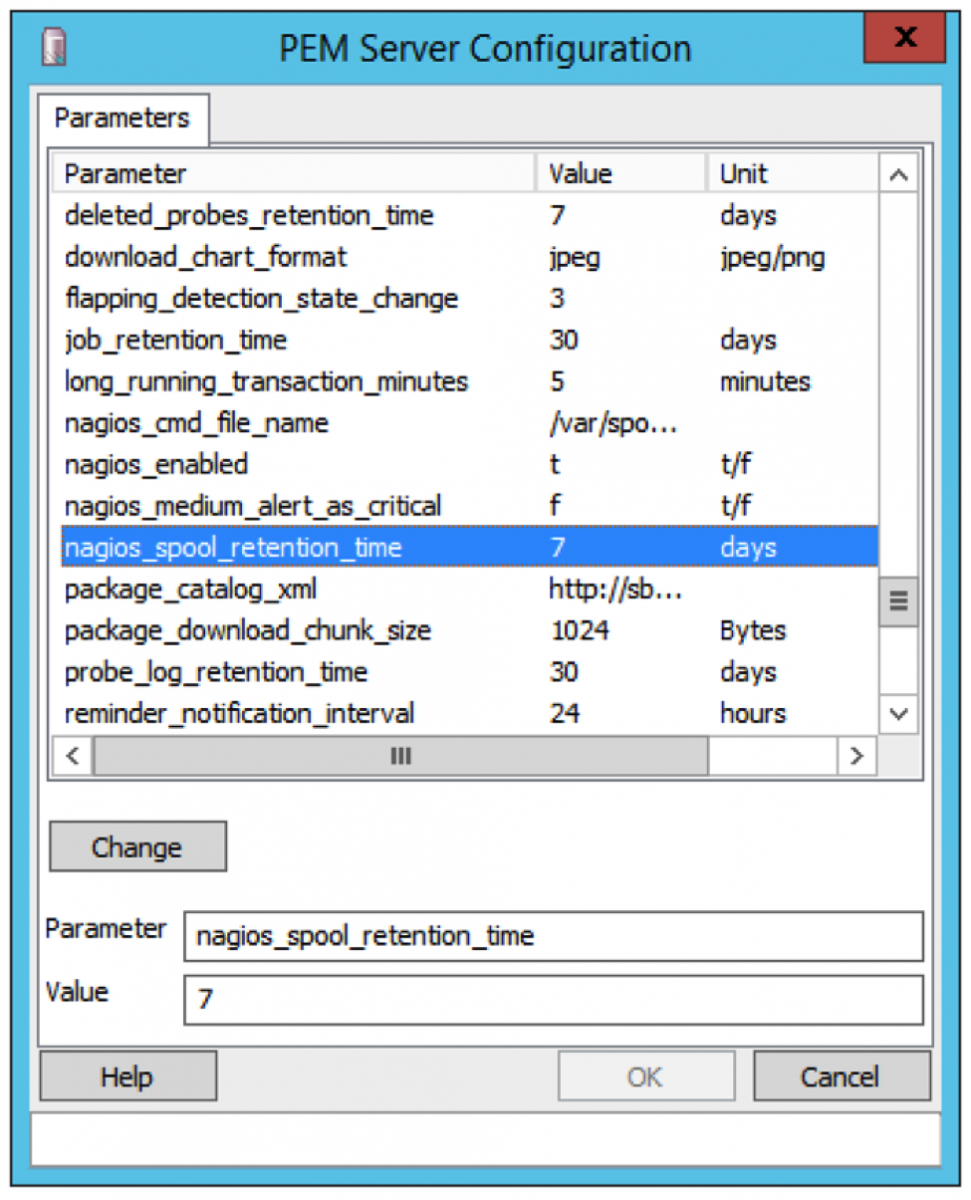
- Click on Management -> Server -> Configuration
- Scroll through the list of options, and set the following values:
|
nagios_enabled |
t |
|
nagios_cmd_file_name |
/var/spool/nagios/cmd/nagios.cmd1 |
|
nagios_medium_alert_as_critical |
t2 |
- Adjust the path to the command file as appropriate for the Nagios installation. This path is defined in Nagios using the command_file configuration option.
- PEM has three alert levels, whilst Nagios only has two. Use this option to specify whether a medium level alert in PEM should be considered critical in Nagios (t) or warning (f).
Host configuration
Next, the hosts must be configured in Nagios. A function in the PEM database will generate a configuration file snippet that can be placed in the Nagios conf.d directory.
SELECT pem.create_nagios_host_config(
'linux-server',
'linux40.png',
NULL,
'linux40.gd2'
);
The function parameters are used as follows:
- The name of a Nagios host template to use in the host definition.
- The name of a raster image to use as the host’s icon in Nagios.
- The text to display on mouse-over of the host icon in the Nagios user interface. If NULL, each PEM Agent’s description will be used.
- The name of a vector image to use as the host’s icon in Nagios’ status maps.
Use the PEM client or psql command line utility to execute the function call, and save the result into a file such as /etc/nagios/conf.d/pem-hosts.cfg. The file should look something like the following:
[root@pem-server ~]# head -32 /etc/nagios/conf.d/pem-hosts.cfg
define host {
host_name pem-loadgen-1
address 192.168.1.127
active_checks_enabled 0
passive_checks_enabled 1
icon_image linux40.png
icon_image_alt pem-loadgen-1
statusmap_image linux40.gd2
use linux-server
}
define host {
host_name pem-loadgen-10
address 192.168.1.169
active_checks_enabled 0
passive_checks_enabled 1
icon_image linux40.png
icon_image_alt pem-loadgen-10
statusmap_image linux40.gd2
use linux-server
}
define host {
host_name pem-loadgen-2
address 192.168.1.128
active_checks_enabled 0
passive_checks_enabled 1
icon_image linux40.png
icon_image_alt pem-loadgen-2
statusmap_image linux40.gd2
use linux-server
}
Service configuration
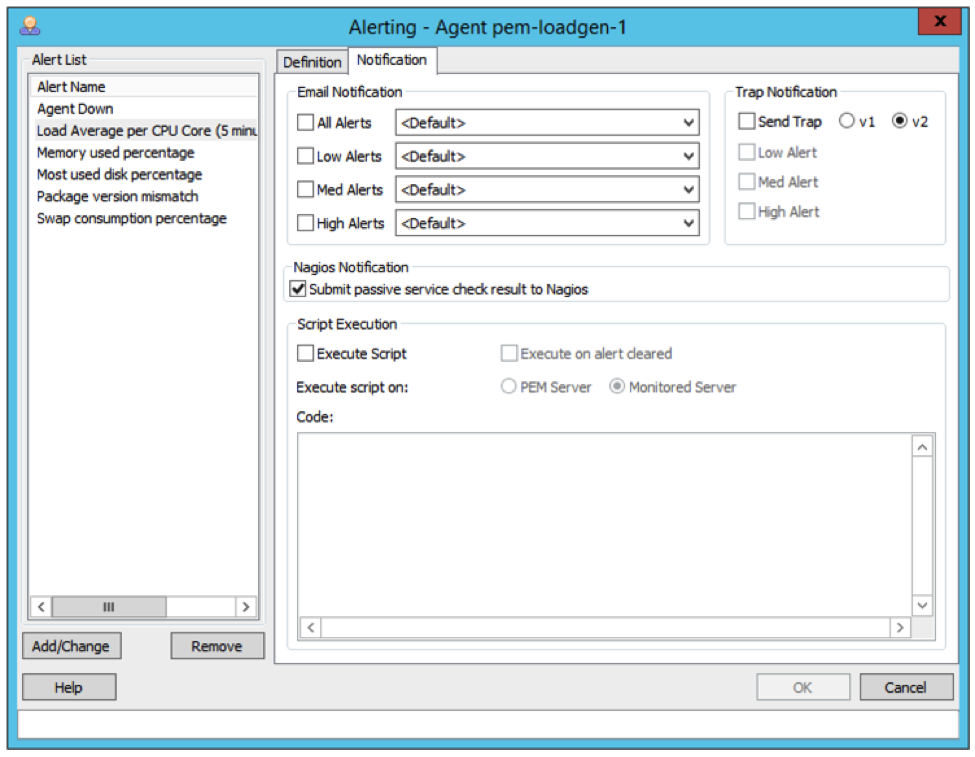
Service configuration is generated in PEM in much the same way as the host configuration, with the exception that services entries are only created for PEM Alerts that are enabled and configured to send status changes to Nagios. You can configure alerts as follows:
- Select the object on the treeview in the PEM client that you wish to create or modify an alert on, and select Management -> Alerting… from the menu.
- Setup a new alert if desired (following the instructions in the PEM documentation), or edit an existing one by selecting it in the panel on the left of the dialogue.
- Select the Notification tab and the check the Submit passive service check result to Nagios option.
- Click the Add/Change button to update the alert configuration, and then click OK to save the changes.
Repeat this process to enable Nagios submission for all desired alert. The Copy Alerts tool (Maintenance -> Copy Alerts…) may be used to copy the alert definitions between hosts, servers, and other objects to save time.
Once the alerts have been configured, the service file can be generated. The function call to do so looks like the following:
SELECT pem.create_nagios_service_config(
'generic-service'
);
The parameter given specifies the name of a Nagios service template to derive the service definition from.
Use the PEM client or psql command line utility to execute the function call, and save the result into a file such as /etc/nagios/conf.d/pem-services.cfg. The file should look something like the following:
[root@pem-server ~]# head -50 /etc/nagios/conf.d/pem-services.cfg
define service {
host_name pem-loadgen-1
service_description A user expires in N days - svr: pem-loadgen-1
use generic-service
check_command check_ping!3000.0,80%!5000.0,100%
check_freshness 0
active_checks_enabled 0
passive_checks_enabled 1
}
define service {
host_name pem-loadgen-1
service_description Connections in idle-in-transaction state- as a percentage of max_connections - svr: pem-loadgen-1
use generic-service
check_command check_ping!3000.0,80%!5000.0,100%
check_freshness 0
active_checks_enabled 0
passive_checks_enabled 1
}
define service {
host_name pem-loadgen-1
service_description Last AutoVacuum - svr: pem-loadgen-1
use generic-service
check_command check_ping!3000.0,80%!5000.0,100%
check_freshness 0
active_checks_enabled 0
passive_checks_enabled 1
}
define service {
host_name pem-loadgen-1
service_description Server Down - svr: pem-loadgen-1
use generic-service
check_command check_ping!3000.0,80%!5000.0,100%
check_freshness 0
active_checks_enabled 0
passive_checks_enabled 1
}
define service {
host_name pem-loadgen-1
service_description Total connections as percentage of max_connections - svr: pem-loadgen-1
use generic-service
check_command check_ping!3000.0,80%!5000.0,100%
check_freshness 0
active_checks_enabled 0
passive_checks_enabled 1
}
Restart Nagios
Nagios must be restarted once the configuration is complete. On CentOS/RHEL 7.x that can be done using the systemctl command, for example:
[root@pem-server ~]# systemctl restart nagios
Prime Nagios
Passive service checks in Nagios will stay at an ‘unknown’ state until a state change is received. In a perfect world we’ll never see any state changes as we’ll never get any alerts, but of course in practice we’re likely to see some, but not necessarily for some time. A function is provided in PEM 6.0.2 and above that allows the current state of all alerts to be sent to Nagios to ‘prime’ the services:
SELECT pem.prime_nagios_passive_alerts();
This step is optional, but does both set an initial value for the service checks, and test that the passive service results are being received by Nagios from PEM.
Conclusion
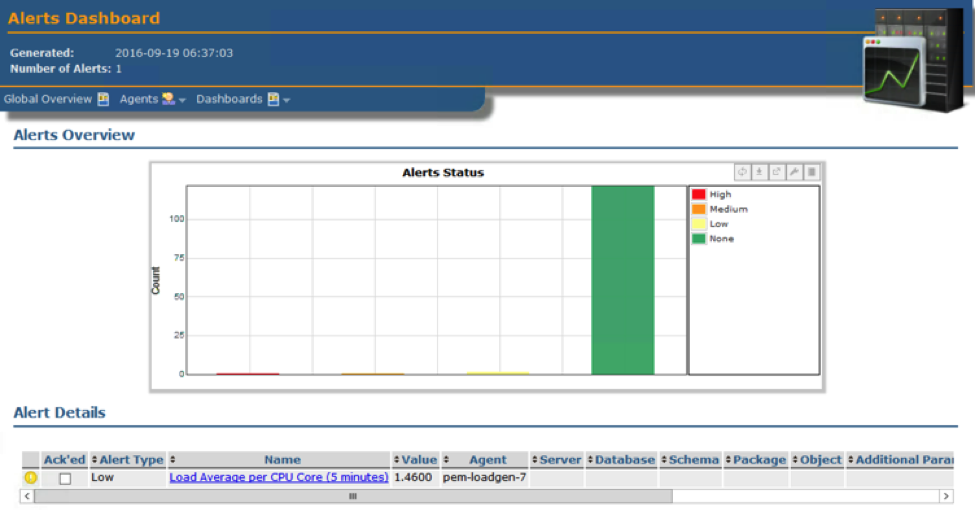
At this point both systems should be configured, and any active alerts in PEM should be shown as faulting services in Nagios. Active notifications may be sent directly from PEM to administrators via email, SNMP or any scripted method, or from Nagios using its notification mechanisms.
The status of the alerts in PEM can be compared with the services in Nagios by checking the dashboards of both tools. For example, the PEM Alerts dashboard may look like the following screenshot:
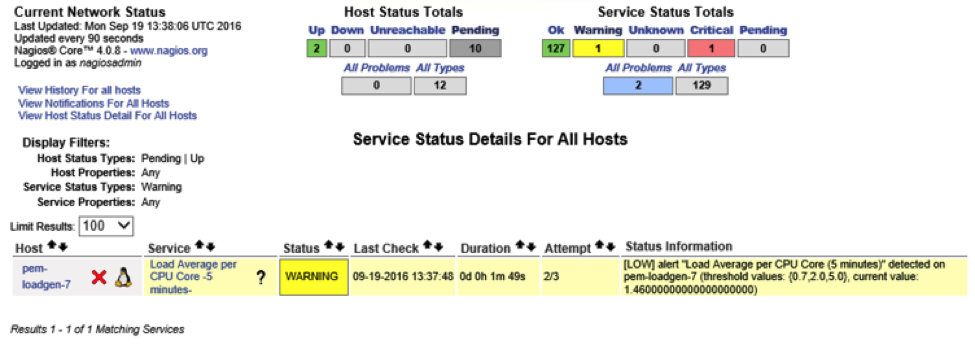
We can see the same alerts in the Nagios console:
Dave Page is Vice President, Chief Architect, Tools and Installers, at EnterpriseDB.
Relevant Blogs
Replication Server 7 vs Postgres Distributed 5.0: Which Offers Better Performance and Scalability?
Introduction EDB provides the tool EDB Replication Server (xDB/EPRS) 7.4 that's a trigger or physical replication-based system with a managed process for data distribution. It can perform multi-master replication, but...
Transparent Data Encryption Impacts on EDB Postgres Advanced Server 15
Introduction Transparent data encryption (TDE) is an optional feature supported by version 15 of EDB Postgres Advanced Server and EDB Postgres Extended Server. It encrypts any user data stored in...